
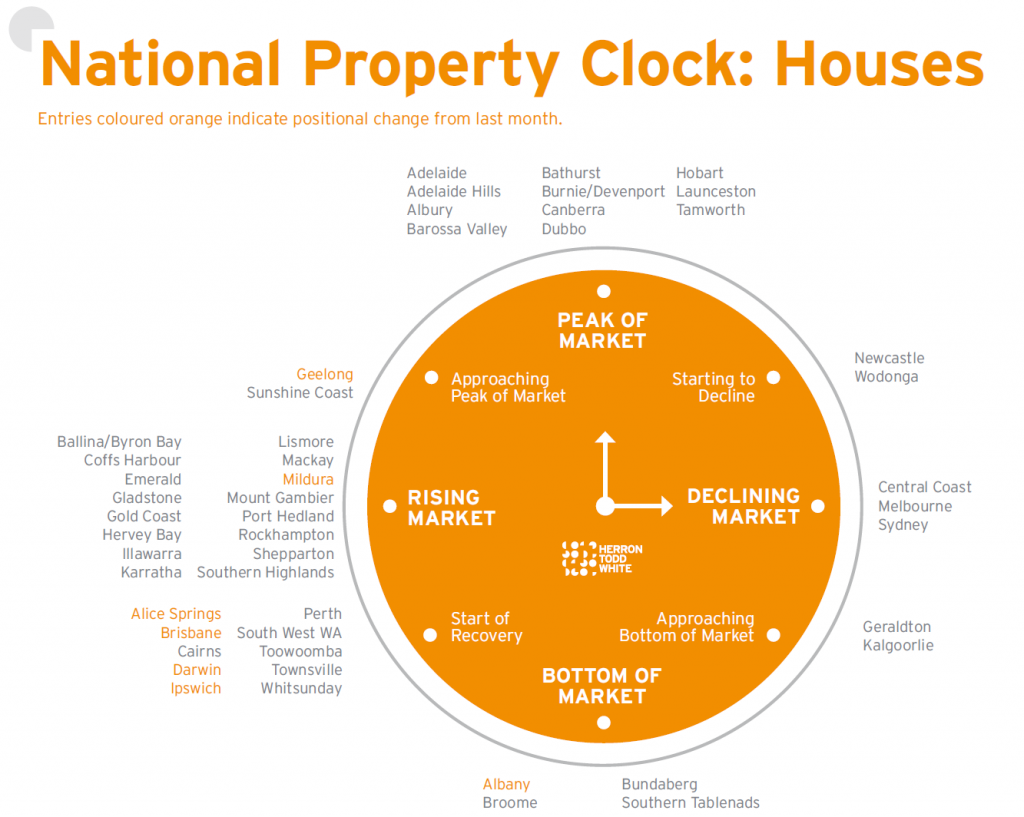
This week we’re looking at regional centres and how they’re performing in the current market. Our analysis is based on the ‘property’ clocks published by valuers Herron Todd White.
About the data
A major point to make up front is that markets do not operate in a ‘normal’ clock formation – a better representation of market movement would be in a spiral shape where markets move backwards (spiralling down) as well as upwards, and many areas that just stay in the one place for a lengthy period of time.
But, for ease of communication, HTW uses the clock graphic to convey the direction they see each area heading.
This data was compiled prior to the Federal Budget announcements made on 6 October 2020, but includes information that tracks the impact of COVID-19 and the trend towards the new normal of ‘working from home’ (WFH).
Market summary
Across the board, the Homebuilder government incentive has activated the demand for new builds with some alarming results.
- Vacant land is rising in price which means developers are making money and buyers are purchasing at inflated prices.
- Builder incentive packages are dropping – there’s no point in developers offering incentives when the government is doing it for you and demand has bounced back.
- Largely due to the Homebuilder incentives and the lack of available land – outlying regions with more land available are experiencing an increase in interest.
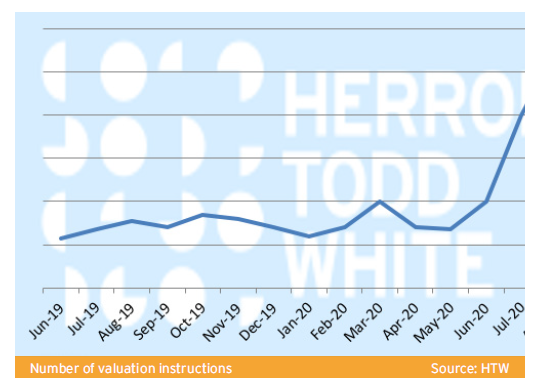
- Cairns – an area hit hard by a downturn in tourism – is experiencing a massive upturn in sales – up 33% in May, 50% in June, and 28% in July, with this trend on track to continue into September (page 50) include the graph. They’re coming off a very low base, but I don’t see investors doing too well here. Experience tells me the results are due to some hard selling into southern buyers who will soon join the ranks of property regret in a few months’ time.
- Even Alice Springs is experiencing a mini bounce.
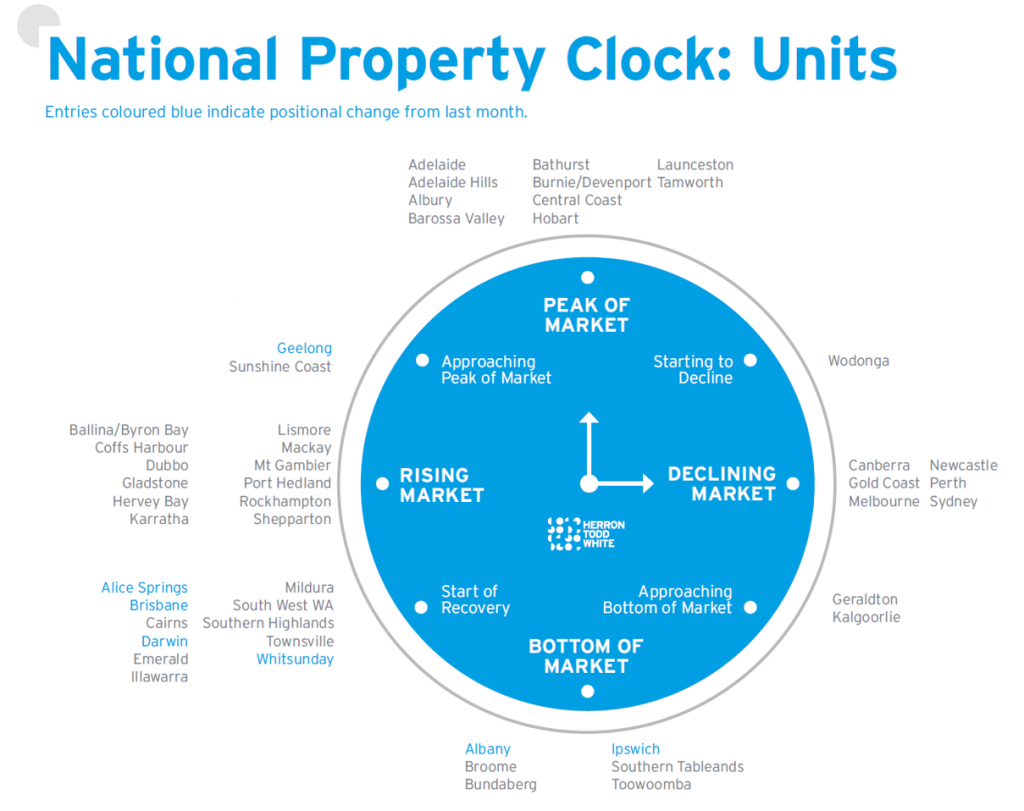
- There’s more areas ‘on the rise’ than on the decline – I would have expected more declining areas on the unit graph.
One final point to consider when looking at the ‘clocks’ below, note that the graphs are based on ‘area / suburb’ level data and you can still find profitable property in areas that may be listed as ‘declining’. Ensure you utilise a range of reputable data sources before making decisions.
If you would like to discuss the best areas to make your next purchase, email me at debra@propertyfrontline.com.au.
About the author
Debra Beck-Mewing is the Editor of the Property Portfolio Magazine and CEO of The Property Frontline. She has more than 20 years’ experience in buying property Australia-wide and has extensive experience in helping buyers use a range of strategies including renovating, granny flats, sub-division and development. Debra is a skilled property strategist, and a master in identifying tailored opportunities, homes and sourcing properties that have multiple uses. She is a Qualified Property Investment Advisor, licensed real estate agent and also holds a Bachelor of Commerce and Master of Business. As a passionate advocate for increasing transparency in the property and wealth industries, Debra is a popular speaker on these topics. She is also an author, podcast host, and participates on numerous committees including the Property Owners’ Association.
Follow us on facebook.com/ThePropertyFrontline for regular updates, or book in for a strategy session to discuss your property questions.
Disclaimer – This information is of a general nature only and does not constitute professional advice. We strongly recommend you seek your own professional advice in relation to your particular circumstances.


