
2022 . . . I think I want my money back. This was the year that was going to be fabulous after the tricky events of the past few years. Instead, 2022 has not delivered the party we were expecting.
Of course, it’s not all bad, but with the markets in a state of flux, this time of year is a great time to take stock of the state of play as we take a breath before the crazy Spring buying season gets going. On the upside, while we’re not yet in a buyers’ market, currently buyers have more to party about now than anytime in the past three years.
A view from the top – who owns what?
Starting our analysis with ownership data, see below for the most recent information showing property ownership for the taxation year ending June 2020 – there’s always a lag to allow for all returns to be registered and for the data to be analysed so we won’t be able to access information on ownership for 2022 until midway through 2024.
While the data relates to the 2020 tax year, it provides factual insights into the changing state of the Australian property market. The ATO statistics (see graph below) revealed that 1,592,883 Australians have an interest / owned one rental property, and 19,895 own six or more properties.
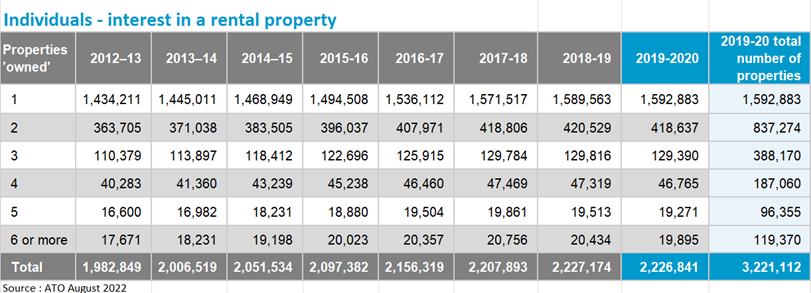
Overall, the number of people with investment properties dropped in 2020, decreasing by 539. The number of people owning 2, 3, 5 or 6 properties decreased, representing a definite trend towards selling investment properties in the early stages of the pandemic.
Positive or negative
During the 2019-2020 tax year interest rates fell to the historically low levels, however rents also tanked – particularly in city areas. Despite this roughly 50% of the investment properties owned during this period were negatively geared. Once again this pours water on the media alarmists’ assumptions that ‘all’ property owners are leveraging taxes.
Property ownership mix
Using the data in the table above and acknowledging we can’t calculate the exact total number of properties owned by the ‘6 or more’ group, the table shows roughly 3,221,112 properties can be categorised as investment properties.
CoreLogic reports that our total market is currently comprised of roughly 10,800,000 properties (an increase of 200,000 at the same time in 2021), so we can allocate the remaining 7,578,888 as owner occupied. That means home owners control 70% of the Australian property market. This group tends to hold their properties for much longer than investors and during market downturns will normally dig in rather than sell.
The other story from this data is the spotlight on the extreme rental crisis we’re currently experiencing in nearly every market across Australia. At the end of the 2019-2020 tax year, there was 8,402 less investment properties held by individuals according to the data tables. While that’s a slight drop, the rental crisis has only started to really bite in the past six months so it will be interesting to see if there was a more extreme sell off during the 2020-2021 tax year . . .we’ll have to wait another 12 months to find out though.
Market stability
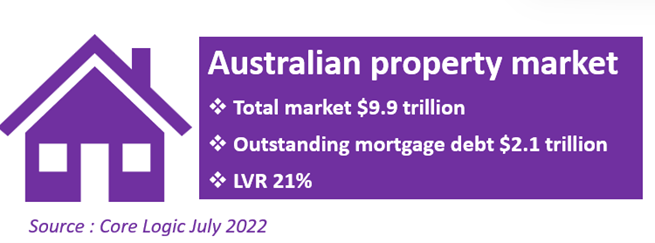
CoreLogic report the combined value of all properties at 30 June 2022 is $9.9 trillion, with an outstanding mortgage debt of $2.1 trillion. This means our nation-wide loan to value ratio (LVR) is 21%. This is an exceptionally healthy financial position but even so, it doesn’t justify the RBA’s stance that we “can afford” a bit of an increase in interest rates.
Owners in charge
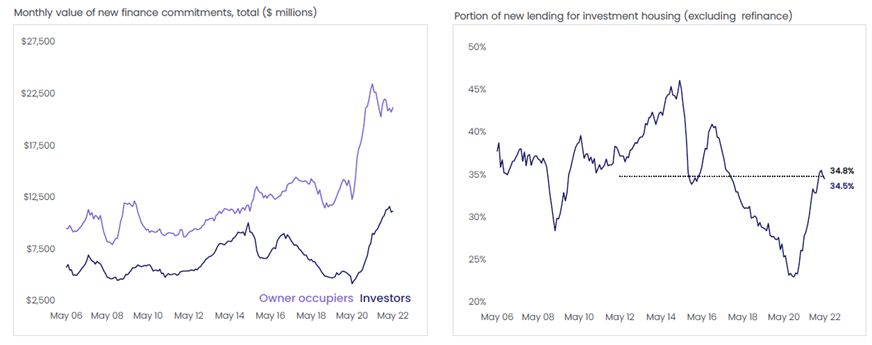
Further emphasising the success of strategies to hold investors back while encouraging home ownership is the lending activity outlined in the graph below. Once again, the information below is the latest data available, but shows loan approvals to the end of May 2022.
If anyone wants to know the base for the rental crisis, this is the story here in black and white. The forced restrictions imposed by APRA meant a crash in investor lending which translated into four years of falling approvals. While there has been a rally of investor lending in the past six months, this has also started to drop back with the rise in interest rates.
Demand drivers
All the above information is great to have, but basically it’s just history . . .we need to look to a different data set to understand what will happen over the horizon. To get an idea of where the market is heading we need to take a look at demand and also supply.
Australia currently has a population of 25.9 million (minimal change in the past 12 months . . .you know why), and it’s a sad fact that not all of us will own any property, let alone two or more for their property portfolio.
Currently, all 25.9 million of us are residing in 10,800,000 dwellings – 7.5 million in homes and 3.2 million in rental properties. Using these high level figures means around 2.4 people per dwelling.
Things, of course, look much different when it comes to real life rather than statistics. The past two ABS Census results (2011 and 2016) have reported an increasing trend of lone-person households. The latest estimate has at least 2.5 million or 1 in 10 Australians living alone.
Looking at things this way, it’s easy to see how a range of organisations estimate an undersupply of dwellings to be between 200,000 to 500,000. We’ll talk more about the supply side shortly.
Population projections
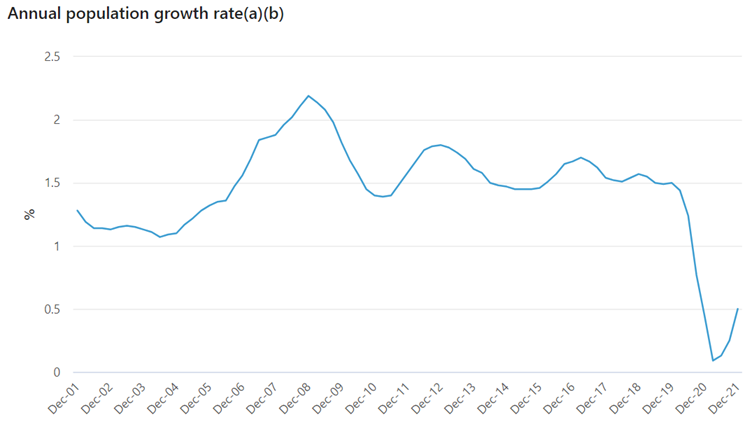
This time last year, the ABS was projecting an increase of 5,000,000 in the Australian population by 2032 (over the next ten years) however this has now been revised down to an increase of 3,000,000. See below for the massive population drop off due to the pandemic.
The government is taking steps to pull the population back up, but it’s safe to say we’re expecting a significant increase in the population over the next decade. So . . if we’re already around 500,000 dwellings behind what we really need now, where’s the extra five million going to live?
Supply
With a conservative projection of an increase in population by 5,000,000 and an undersupply already in existence of approximately 500,000, to ensure we’re going to have some chance to house this growing population we will need to increase the number of dwellings by around 2,200,000 over 10 years.
How are we doing with this? Not great.
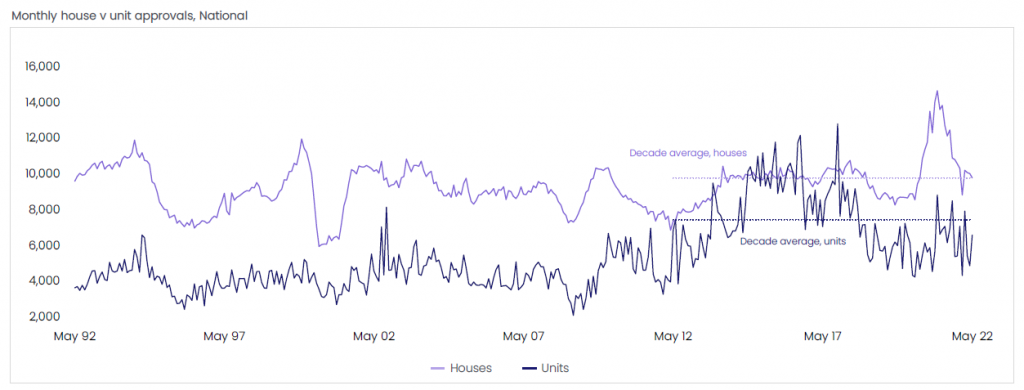
On the upside, as the following graph shows, the government incentives offered to first time buyers have resulted in a solid jump of demand for houses. However the pandemic and poor perception of the unit market have caused a large drop in demand for units.
From a pure numbers perspective, to meet the housing demand of an increase in population of 5,000,000 in ten years, we would need to build 220,000 dwellings per year. And that’s without filling the gap we already have of around 500,000 dwellings.
Unfortunately, we’re currently building much less than the 220,000 target, with a total of 190,000 dwellings built in 2021. Here’s hoping we can pick that pace up, but in the meantime excuse me while I run out and buy some more property before it runs out – literally. The issue becomes even more nuanced when you consider trying to ensure the right mix of property is constructed in the right location.
How many properties do you need?
While the data is great, what does this really mean for you? Firstly, at a high level you can safely say there’s a solid level of demand in the property market for the foreseeable future. The 2021 Census data found 30% of the population were renting on Census night (10 August 2021). This trend should mean property investors will continue to find a solid supply of tenants as long as investors own property types tenants want.
So, if you’re aiming to build a property portfolio that delivers liveable continuous income, the question shouldn’t only be ‘how many’ properties you’ll need, but also what types are best along with location.
Want some help?
At The Property Frontline, we have developed a system for calculating and acquiring the number and type of properties each individual will need to replace their earned income with unincumbered rental income. If you would like to know the amount and type of properties you will need to achieve your targets, book in for a Property Clarity Call here.
About the author
Debra Beck-Mewing is the Editor of the Property Portfolio Magazine and CEO of The Property Frontline. She has more than 20 years’ experience in buying property Australia-wide and has extensive experience in helping buyers use a range of strategies including renovating, granny flats, sub-division and development. Debra is a skilled property strategist, and a master in identifying tailored opportunities, homes and sourcing properties that have multiple uses. She is a Qualified Property Investment Advisor, licensed real estate agent and also holds a Bachelor of Commerce and Master of Business. As a passionate advocate for increasing transparency in the property and wealth industries, Debra is a popular speaker on these topics. She is also an author, podcast host, and participates on numerous committees including the Property Owners’ Association.
Follow us on facebook.com/ThePropertyFrontline for regular updates, or book in for a strategy session to discuss your property questions.
Disclaimer – This information is of a general nature only and does not constitute professional advice. We strongly recommend you seek your own professional advice in relation to your particular circumstances.


