
Lockdowns aside, this time of year is a great time to take stock of the market as we take a breath before the crazy Spring buying season gets going.
Who owns what
Starting our analysis with ownership data, see below for the latest information published in June 2021 for the taxation year ending June 2019 – there’s always a lag to allow for all returns to be registered and for the data to be analysed.
While the data relates to the 2019 tax year, it provides solid factual insights into the changing state of the Australian property market. The ATO statistics revealed (see graph below) that 1,589,563 Australians have an interest / owned one rental property, and 20,434 own six or more properties.
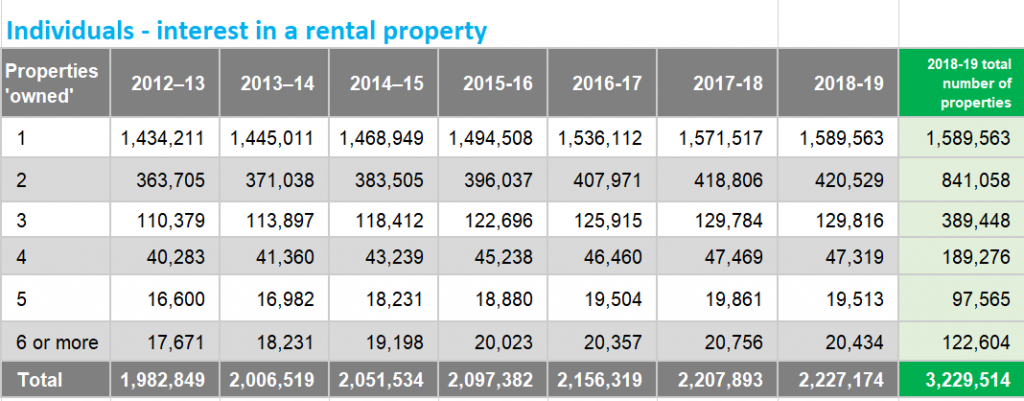
The interesting change is that the number of people owning 4, 5 or 6 or more properties actually dropped in the 2019 tax year. It highlights the prevailing focus at the time where APRA and the RBA were trying to cool the property market by restricting access to funds. Despite these tactics, the total number of people with an interest in an investment property increased by approximately 20,000.
How many properties?
Using the data in the table above and acknowledging we can’t calculate the total number of properties owned by the ‘6 or more’ group, the table shows roughly 3,229,514 properties can be categorised as investment properties.
CoreLogic reports that our total market is comprised of roughly 10,600,000 properties, so who owns the other 7,370,486 properties . . .home owners? That means homeowners control 70% of the Australian property market. A side note here is this represents a solid group that will traditionally dig in rather than sell if the market softens.
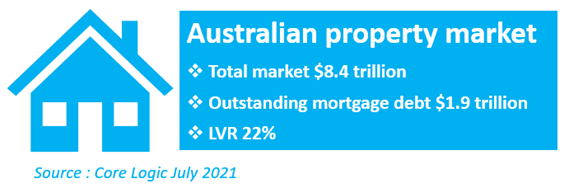
CoreLogic also reports that the combined value of all properties is $8.4 trillion, with an outstanding mortgage debt of $1.9 trillion. This means our nation-wide loan to value ratio (LVR) is 22%, which is an exceptionally healthy financial position.
Investor insights
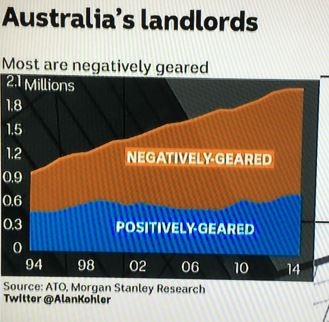
Providing more evidence of the strong market undercurrent is a change in the number of investors who use negative gearing.
Data from the Australian Tax Office shows that of the 2.2 million taxpayers who owned at least one rental property, only 1.3 million (58%) declared a net rental loss in 2018-19.
This trend has occurred more by chance than design as rental returns have mostly remained consistent while interest rates have dropped.
Only a few years ago the number of investors negatively gearing was 75%, as reflected in the image below.
Owners in charge
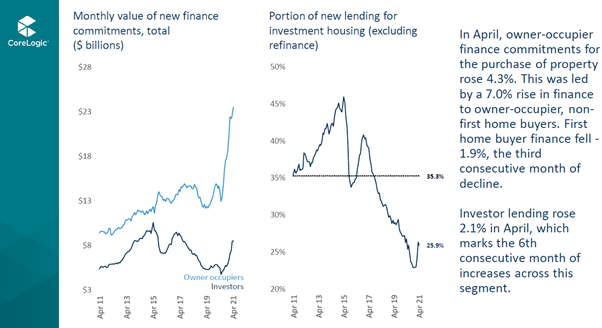
Further emphasising the success of strategies to hold investors back while encouraging homeownership is the lending activity outlined in the graph below.
Once again, the information below is the latest data available but shows loan approvals to the end of April 2021.
Note the radical bounce in owner-occupied activity which almost doubled in the past 12 months. Contrast this with the lending to investors (RHS graph), which is still 10% behind the peak of 2017.
Trading activity
The pace of activity is also another very interesting insight. Despite the global pandemic, the number of properties traded in the past 12 months increased by approximately 20% and is one of the highest on record.
Drawing upon CoreLogic data, properties traded to the end of May 2021totalled 553,583 compared to 423,007 in 2020 and 412,154 in 2019. In a word, the market was F.A.S.T.
Another view
All the above information is great to have but basically it’s just history . . .we need to look to a different data set to understand what will happen over the horizon.
To get an idea of where the market is heading we need to take a look at supply and demand. This will include a mix of homes and investment properties.
Demand side
Australia currently has a population of 25.8 million, and it’s a sad fact that not all of us will own any property, let alone two or more for their property portfolio.
Currently, all 25.8 million of us are residing in 10,600,000 dwellings – 7.3 million in homes and 3.2 million in rental properties. Using these high level figures we’re 2.4 people use one dwelling.
Things, of course, look much different when it comes to real life rather than statistics. The past two ABS Census results (2011 and 2016) have reported an increasing trend of lone-person households. The latest estimate has at least 2.5 million or 1 in 10 Australians living alone.
Looking at things this way, it’s easy to see how a range of organisations estimate an undersupply of dwellings to be between 200,000 to 500,000.
Population projections
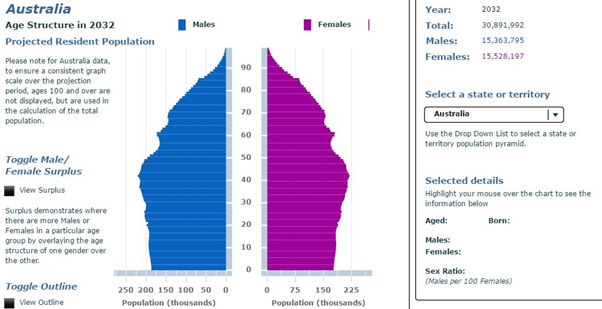
Outlined below is the Australian Bureau of Statistics population forecast. They’re projecting an increase of roughly five million Australian residents in just 10 years even taking into account the impacts of the global pandemic.
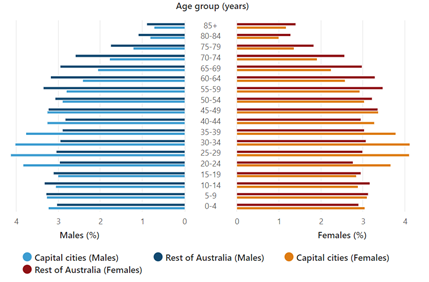
This information becomes even more intense when we look at where the population increase will reside. The greater majority will of course be clustered in the major cities, and emerging baby belt bulges such as Western Sydney.
Supply
With a conservative projection of an increase in population by 5,000,000 and an undersupply already in existence of approximately 300,000, to ensure we’re going to have some chance to house this growing population we will need to increase the number of dwellings by around 2,200,000 over 10 years.
How are we doing with this? Not great.
On the upside, as the following graph shows, the government incentives offered to first-time buyers have resulted in a solid jump of demand for houses. However, the pandemic and poor perception of the unit market have caused a large drop in demand for units.
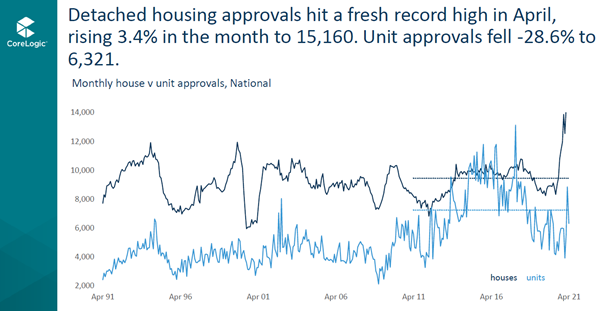
From a pure numbers perspective, to meet the housing demand of an increase in population of 5,000,000 in ten years, we would need to build 220,000 dwellings per year.
Unfortunately, we’re currently building much less than this, with a total of 180,000 built in 2020. Here’s hoping we can pick that pace up, but in the meantime, excuse me while I run out and buy some more property before it runs out – literally.
The issue becomes even more nuanced when you consider trying to ensure the right mix of property is constructed in the right location.
How many properties do you need?
While the data is great, what does this really mean for you? Firstly, at a high level, you can safely say there’s a solid level of demand in the property market for the foreseeable future.
A study conducted by the ABS found an increasing number of the population are renting, resulting in 32 % of the population renting during 2018. The 2021 Census is expected to find this number has increased, despite the government assistance packages made available in the past 18 months.
This trend should mean property investors will continue to find a solid level of supply of tenants, of course as long as investors own property types tenants want. Owners of one and two-bedroom CBD units are currently facing the stark reality of how quickly a change in demand can impact their rental returns.
So, if you’re aiming to build a property portfolio that delivers liveable continuous income, the question shouldn’t only be ‘how many’ properties you’ll need, but also what types are best along with the location.
Want some help?
At The Property Frontline, we have developed a system for calculating and acquiring the number and type of properties each individual will need to replace their earned income with unincumbered rental income. If you would like to know the amount and type of properties you will need to achieve your targets, book in for a chat here.
About the author
Debra Beck-Mewing is the Editor of the Property Portfolio Magazine and CEO of The Property Frontline. She has more than 20 years’ experience in buying property Australia-wide and has extensive experience in helping buyers use a range of strategies including renovating, granny flats, sub-division and development. Debra is a skilled property strategist, and a master in identifying tailored opportunities, homes and sourcing properties that have multiple uses. She is a Qualified Property Investment Advisor, licensed real estate agent and also holds a Bachelor of Commerce and Master of Business. As a passionate advocate for increasing transparency in the property and wealth industries, Debra is a popular speaker on these topics. She is also an author, podcast host, and participates on numerous committees including the Property Owners’ Association.
Follow us on facebook.com/ThePropertyFrontline for regular updates, or book in for a strategy session to discuss your property questions.
Disclaimer – This information is of a general nature only and does not constitute professional advice. We strongly recommend you seek your own professional advice in relation to your particular circumstances.


